Merchant Services Cost Analysis: Find Hidden Processing Fees
Perform a merchant services cost analysis to uncover hidden processing fees, lower international charges, and cut total credit card transaction costs today.
Published

The headline rate on your processing statement does not show the full cost. A merchant services cost analysis reviews the charges behind that rate, separates pass-through costs from potentially negotiable fees, and identifies where savings may be possible. It can also account for international transactions, where currency conversion and cross-border charges affect the cost of each sale.
A clear rate may sound like a clear bill, but monthly fees, transaction charges, and international markups can make total costs harder to see. A useful analysis connects each charge to your actual processing activity, so you can understand what you pay and why.
This article explains how a cost analysis identifies processing fees, assesses potential savings, and projects costs as transaction volume or business needs change. It also covers how foreign transaction fees and dynamic currency conversion affect cross-border sales, and why reviewing those charges alongside domestic processing costs gives you a fuller picture.
Key Takeaways
- Compare pricing structures by separating pass-through costs from processor markups and other fees.
- Review statement details to spot charges that a headline rate can hide, including transaction-level and recurring fees.
- Value potential savings against your actual processing activity, then forecast how volume and business changes could affect costs.
- Include cross-border transactions in your review; currency conversion and international charges can change the cost of a sale.
- Assess how card type, transaction size, and industry affect processing costs before deciding which pricing structure fits your business.
Table of Contents
- What is a Merchant Services Cost Savings Analysis?
- Interchange fees and hidden processing costs
- Cost identification, valuation, and forecasting
- International transaction and currency conversion fees
- How do payment processing costs differ by card type, transaction size, and business industry?
- Renegade Payments: Dual Pricing
What is a Merchant Services Cost Savings Analysis?
A merchant services cost analysis compares your current payment setup with the projected cost of an alternative. It uses statement details, sales patterns, and operating assumptions to estimate potential savings and future spending. The aim is a grounded comparison, not a promise based on a headline rate.
The result is only useful when it reflects how your business takes payments. Volume matters, but so do order size, service demands, sales channels, and the costs of reaching each customer. Compare those drivers alongside your processing expenses.
Pricing Structures and Fee-Offset Programs
A pricing structure determines how processing costs are calculated and allocated across transactions. Fee-offset programs change how some costs are handled at checkout, so compare their effect on customer payments as well as your net processing expense.
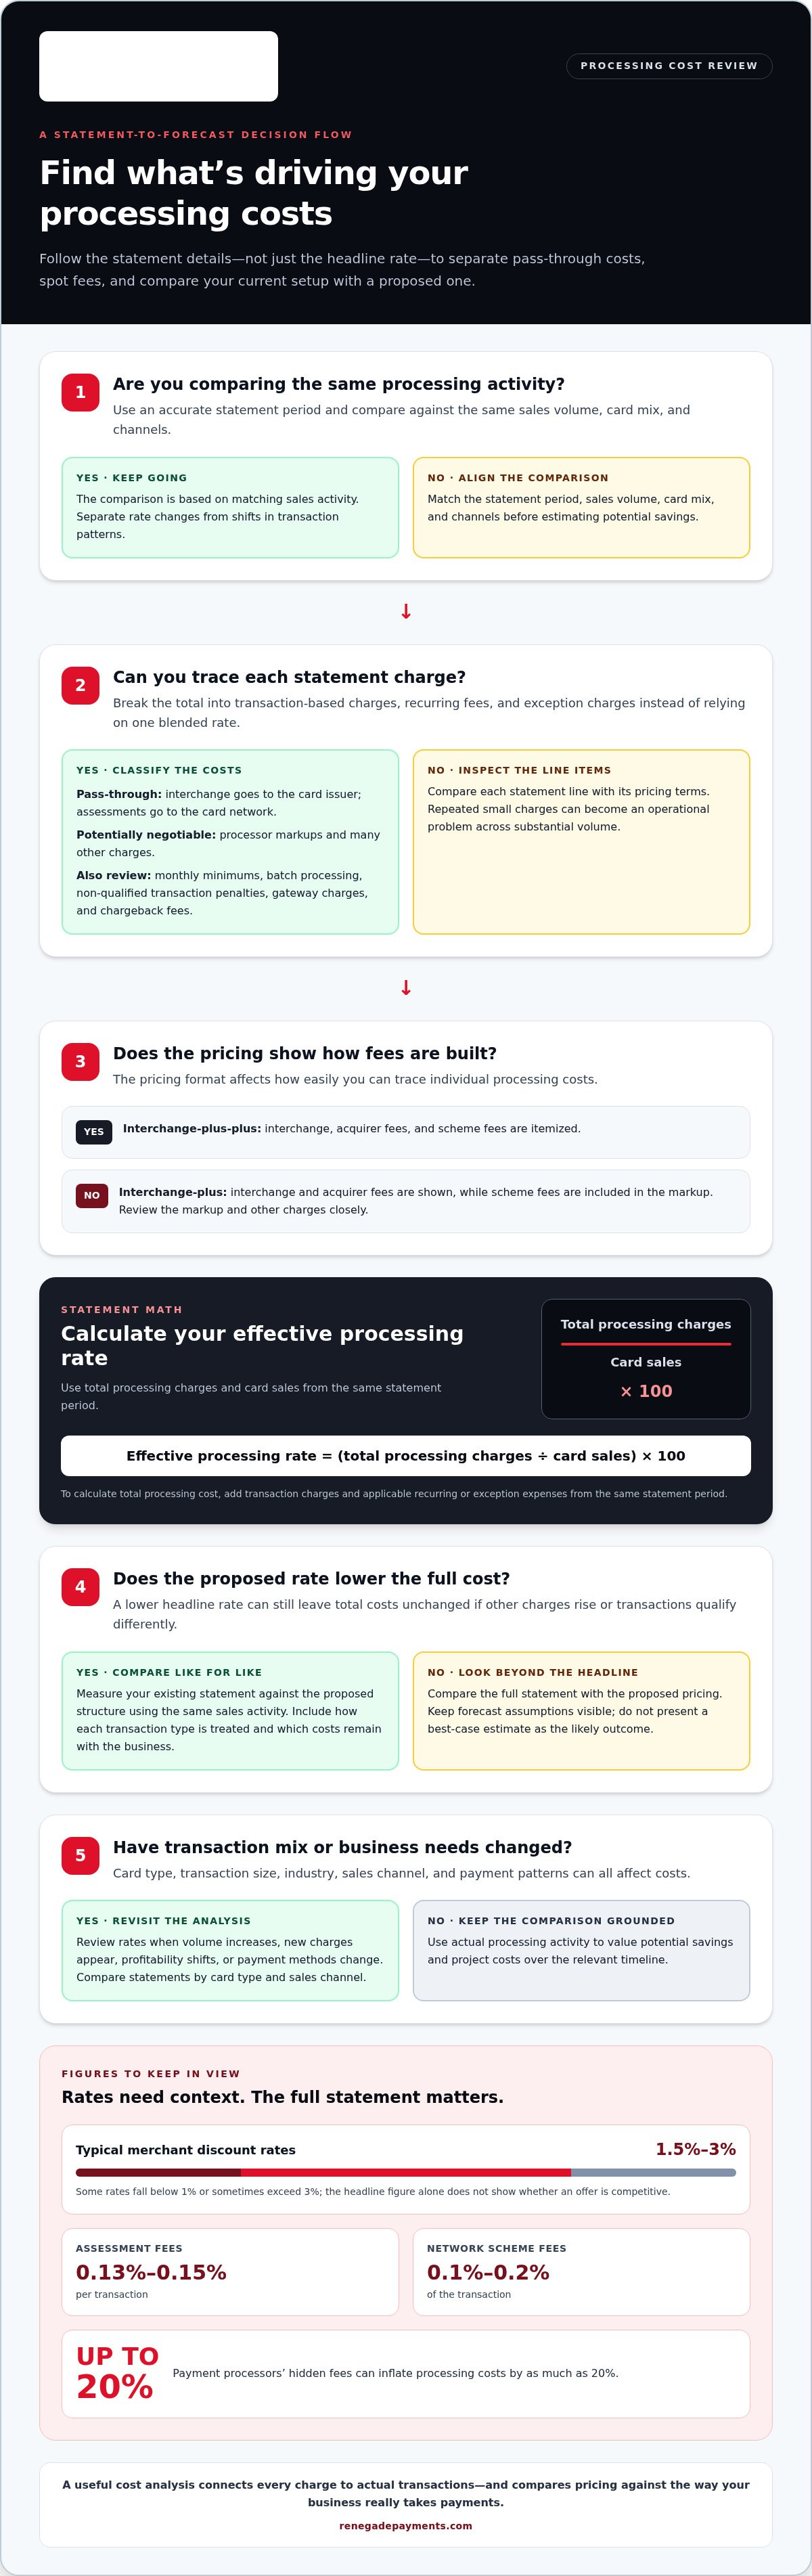
Typical merchant discount rates range from 1.5% to 3%, while some fall below 1% or sometimes over 3%. Those figures alone don’t show whether an offer is competitive. Compare the full statement with the proposed structure, including how each transaction type is treated and which costs remain with the business.
Current and Potential Processing Rates
Comparing current and potential processing rates means measuring your existing statement against a proposed structure using the same sales activity. It matters because a lower headline rate can still leave total costs unchanged if other charges rise or transactions qualify differently.
Use an accurate statement period and match it to the same sales volume, card mix, and channels in the comparison. Separate rate changes from shifts in transaction patterns, and make forecast assumptions visible rather than presenting a best-case estimate as the likely outcome. Revisit the comparison when volume or payment methods change.
Illustrative Customer Cost Comparisons
Customer cost comparisons show how different order patterns can change service costs, even when revenue is equal. Revenue alone may hide which customers or channels require more time and resources.
A customer with large, predictable orders can be more than four times as profitable annually. Apply the same principle to payment activity: compare transaction size, frequency, and handling needs before judging a rate.
A cost analysis can also compare in-house marketing with an agency retainer over a 12-month period. Include internal labor, tools, and production alongside the retainer and related agency work. That creates a like-for-like view of total cost, rather than comparing an internal budget line with an agency’s quoted amount. Cost analysis examines internal production costs; price analysis evaluates vendor pricing against external market prices and competitor pricing. Use a merchant services cost analysis to make payment-cost comparisons just as specific.
Interchange fees and hidden processing costs
Interchange and assessment fees are pass-through costs, while processor markups and many other charges may be negotiable.
Review costs when processing volume changes, new charges appear, or profitability shifts. An analysis of your statement connects expenses to actual transactions and can uncover charges that might otherwise go unnoticed.
Types and Components of Processing Costs
Processing costs include transaction-based charges, recurring fees, and charges for exceptions. Separate them to see what drives the total, since a single blended rate can conceal the details.
Interchange goes to the card issuer, assessments go to the card network, and acquirer fees cover processing. Assessment fees are listed at 0.13%-0.15% per transaction. Other potential expenses include monthly minimums, batch processing charges, non-qualified transaction penalties, gateway charges, and chargeback fees. Compare each statement line with its pricing terms; repeated small charges can become an operational problem across substantial volume.
Interchange-plus pricing shows interchange and acquirer fees, with scheme fees included in the markup. Interchange-plus-plus itemizes all three. That distinction affects how easily you can trace each cost. Payment processors’ hidden fees can inflate processing costs by as much as 20%.
Cost Differences by Card, Transaction, and Industry
Costs vary according to the card used, transaction details, and your payment patterns. One advertised rate may not reflect the cost of every sale, so compare the factors behind your transactions.
Interchange fees vary by transaction and card category. Network scheme fees are listed at 0.1% to 0.2% of the transaction. A small sale can feel the fixed portion more heavily than a larger purchase, while card type and transaction details can change the applicable rate.
Industry also shapes the mix of transactions, average order size, and dispute exposure. Compare statements by card type and sales channel, not just by total volume. Review rates regularly and after processing volume increases. This helps identify whether a changed total comes from more sales, a different card mix, or added expenses. For a clearer view of processing cost components, explore this merchant processing cost breakdown.
Cost identification, valuation, and forecasting
Calculate the effective processing rate by dividing total processing charges by card sales, then multiplying by 100. To calculate total processing cost, add transaction charges and applicable recurring or exception expenses from the same statement period.
A useful forecast identifies direct and indirect costs, assigns dollar values to costs and benefits, and projects spending over the relevant timeline. This gives you a stronger basis for accounting and planning than a headline rate alone.
Calculating the Effective Processing Rate
The effective processing rate is your total processing charges expressed as a percentage of card sales. It shows the combined impact of rates and fees, rather than just one advertised component.
Use one statement period for both figures. Divide all processing charges by sales volume, then multiply the result by 100. Compare the calculated rate across periods, while noting shifts in transaction activity that could affect the result.
Calculating Total Processing Cost
Total processing cost is the sum of charges for accepting payments during a defined period. Calculate it before budgeting, because a rate alone may omit recurring or activity-based expenses.
Start with a current merchant processing statement and basic business information. Identify transaction charges, recurring fees, and costs tied to exceptions. Use a consistent period, then compare the totals with revenue and transaction volume. This helps show whether spending rose because of increased activity, a higher cost per dollar, or a different transaction mix.
Forecasts should make their assumptions visible. A 10% increase in volume combined with a 6% increase in cost per dollar produces roughly 16% more network spending. Model those drivers separately before combining them. That helps distinguish growth-related spending from a rise in processing costs, and makes the estimate more useful for an informed decision.
For longer projects, account for when costs and benefits occur. Discount future cash flows to present value; net present value helps compare options with different timing over 3 years. Use activity-based costing to assign expenses to specific activities, then update estimates as operations, costs, or customer needs change. A current forecast supports better decisions about pricing, resources, and payment channels.
International transaction and currency conversion fees
International card sales can carry costs beyond a domestic transaction. For U.S. merchants, foreign transaction fees generally range from 1% to 3% of the transaction amount. Currency conversion can add another layer, so separate each charge before judging the actual cost of an overseas sale.
Dynamic Currency Conversion (DCC) lets a customer see a purchase amount in their home currency at checkout. That convenience can carry a markup as high as 12% above market rates. Determine whether the conversion is applied, who receives its revenue, and how the transaction appears in your processing records. Don’t treat the displayed exchange rate as the full processing cost.
Visa’s US DCSF is 1.5 basis points for domestic card-not-present transactions and 3.5 basis points for cross-border card-not-present transactions in 2026. These network charges differ from a currency conversion markup. Keep them separate in your costing so a cross-border fee isn’t mistaken for the cost of converting currencies.
Use the example to see why gross transaction value and net settlement are different. For your sales, compare the transaction amount with the settlement amount, then match the difference to the statement’s international and conversion entries.
Create a spreadsheet with separate columns for transaction currency, settlement currency, card-present or card-not-present status, cross-border status, conversion amount, and each listed charge. Put domestic and international sales in separate rows. This makes it easier to tell whether a higher total reflects more cross-border sales, a different currency mix, or a changed charge.
Next, calculate the direct international processing cost for each transaction group. Divide the relevant charges by the corresponding sales amount, then compare the results across currencies and sales channels. A blended total can hide costly patterns: one market may involve more currency conversion, while another has more card-not-present payments.
Use these comparisons to identify where to negotiate processing terms and where a checkout discount or currency choice could affect the customer experience. Model alternatives in the same spreadsheet, using consistent sales assumptions. Compare net settlement and total processing cost, not just the displayed rate. This gives you a clearer basis for deciding which international channels to grow and which costs to monitor.
How do payment processing costs differ by card type, transaction size, and business industry?
Processing costs vary with card category, transaction details, and sales patterns. A restaurant, subscription business, and specialty retailer may have different transaction mixes, even if all accept credit cards. Compare your own sales by category rather than treating one overall rate as the cost of every payment.
Card type matters because transactions can have different interchange costs. Credit, debit, rewards, and commercial cards may be priced differently under a processor’s structure. The issuing bank and transaction data also affect how a payment is categorized. Separate card categories in your reporting and compare their share of total processing costs. A change in card mix can shift expenses even when overall sales stay the same.
Transaction size affects how percentage-based and fixed charges apply to each sale. A fixed charge takes a larger share of a small purchase than a large one. For example, compare a customer buying one low-priced item with another placing a larger order. Both payments may have the same percentage rate, but the fixed component weighs differently. Review average transaction size alongside total volume to see the effect.
Transaction method matters too. An in-person tap, an online checkout, and a manually entered payment follow different processing paths. Card-not-present transactions can carry distinct network charges; Visa’s US DCSF is 1.5 basis points for domestic card-not-present transactions and 3.5 basis points for cross-border card-not-present transactions in 2026. Keep those transaction types separate when comparing channels.
Industry influences the transaction mix. A grocery store may process frequent, smaller baskets, while a furniture retailer may handle fewer, larger purchases. A subscription company sees recurring payments, while a travel business may have international sales and currency conversion. These examples show why an industry label alone does not determine a rate. The actual cost drivers include transaction size, card mix, payment channel, and sales pattern.
Create a comparison with rows for card category, transaction method, and sales channel. Track transaction count, sales volume, and processing charges in each row, then compare each group’s effective rate with the overall rate. If online payments cost more than in-person sales, examine whether card mix or cross-border activity explains the difference. This turns broad processing expenses into specific questions about your operations.
Use those findings to decide which payment channels need closer review and where transaction data may improve costing. Request a review of your processing costs to compare your current payment mix and identify potential savings.
Renegade Payments: Dual Pricing
Renegade Payments helps businesses make processing costs easier to understand through a Free Savings Analysis, Dual Pricing, and Interchange-Plus. Its analysis reviews your current merchant statements to identify hidden processing costs and show where a different setup may fit. Dual Pricing can help offset credit card processing fees at checkout, while Interchange-Plus separates interchange from the processor’s markup for clearer cost visibility.
Consider a statement review when charges are difficult to trace, processing costs have changed, or you are weighing a new pricing structure. The analysis gives you a practical basis for comparing your current setup with potential options. Dual Pricing may suit businesses looking to offset processing costs at checkout, while Interchange-Plus offers a clear breakdown of pricing components.
For a review of your processing costs, contact Renegade Payments or visit renegadepayments.com.
Make Your Next Payment Decision With Clear Numbers
Processing terms should not stay on autopilot as your business, sales channels, and customer habits change. Schedule regular cost reviews and revisit them when you change how or where you accept payments. A merchant services cost analysis gives you a clear starting point: documented charges, actual transaction patterns, and assumptions you can challenge.
Renegade Payments offers a Free Savings Analysis of merchant statements, along with Dual Pricing and Interchange-Plus options. Use the analysis to understand your current setup and consider which pricing structure aligns with your business. The right next step is grounded in your transaction mix, not a headline claim.
Ready to put your processing costs under a closer review? Contact Renegade Payments and take the next step toward clearer payment decisions.
Frequently Asked Questions
What are typical merchant services fees for small businesses in the US?
A typical merchant discount rate ranges from 1.5% to 3% of sales, though actual rates vary. Some businesses pay less than 1%, while others pay more than 3%. Your total depends on transaction mix, card type, payment method, and account charges. Compare total fees against processed sales, not just the quoted rate. A low headline rate can still leave substantial expenses elsewhere on the statement.
How do interchange, assessment, and processor markup fees work?
The card issuer charges interchange, the card network charges assessment fees, and the processor adds its markup for handling transactions. These components may appear separately or as part of a combined rate. For a useful statement review, identify each component and note whether it varies by transaction type or volume. Interchange and assessments are pass-through costs; processor markups and other charges may be negotiable.
What are average credit card processing rates for in-person and online payments?
Typical merchant discount rates range from 1.5% to 3%, but there isn’t one reliable average that applies to every in-person or online sale. The effective rate depends on card type, transaction details, and how the payment is accepted. Compare each channel using the same period and include transaction charges and recurring costs. That shows whether a difference reflects payment method, card mix, or other account expenses.
How do flat-rate, interchange-plus, tiered, and subscription pricing compare?
Flat-rate pricing applies a set rate, making costs easier to estimate but less itemized. Interchange-Plus separates interchange from the processor’s markup. Tiered pricing groups transactions into categories, which can make the final rate harder to trace. Subscription pricing typically separates a recurring processor charge from transaction costs. Compare each model using your own card mix and sales activity, then calculate the full statement cost instead of relying on one advertised component.
What monthly fees, setup fees, PCI fees, and chargeback fees do merchant account providers charge?
Charges vary by account and provider. Check statements for recurring account charges and dispute fees, then compare them with your agreement. Setup charges depend on account terms, so include any quoted amount in your total-cost calculation.
What contract terms, cancellation fees, and hidden charges should businesses check?
Read the agreement for its contract term, renewal process, cancellation notice requirements, and early termination provisions. Also look for monthly minimums, batch processing charges, and non-qualified transaction penalties, which can add 1%-3% above standard rates. Compare every charge with statement entries. A fee that appears under a different label can still affect your total processing cost.
How can businesses negotiate merchant services fees or reduce payment processing costs?
Use recent processing statements to identify your effective rate, transaction mix, and recurring charges before discussing terms. Request a clear comparison based on your actual volume and payment activity. Focus negotiations on processor markup and other negotiable charges, rather than pass-through interchange and assessments. Renegade Payments offers a Free Savings Analysis, Interchange-Plus, and Dual Pricing. Dual Pricing can help offset credit card processing fees at checkout.
Frequently Asked Questions
Clear, straightforward answers about payment processing rules, rates, and terms.
Get your free savings
analysis in 24 hours
Upload a recent processing statement and we'll show you exactly how much you can save. No commitment, no pressure, no sales pitch.